Taman Bidara
68100 Batu Caves, Selangor, Malaysia
68100 Batu Caves, Selangor, Malaysia
Property Type
| Road | Price | PSF | Size | Date | Type |
|---|
|
Jalan Bidara 1/7
|
RM439,000
|
RM566
|
775 sqft
|
|
|
|
Jalan Bidara 1/5
|
RM360,000
|
RM465
|
775 sqft
|
|
|
|
Jalan 1/5
|
RM385,000
|
RM497
|
775 sqft
|
|
|
|
Jalan 2
|
RM330,000
|
RM426
|
775 sqft
|
|
|
|
Jalan Bidara 1/3
|
RM480,000
|
RM619
|
775 sqft
|
|
|
|
Jalan Bidara 2
|
RM350,000
|
RM452
|
775 sqft
|
|
|
|
Jalan Bidara 1
|
RM430,000
|
RM555
|
775 sqft
|
|
|
|
Jalan Bidara 1/6
|
RM275,000
|
RM355
|
775 sqft
|
|
New Launches in Selangor
View all
Posts about Taman Bidara
No posts about Taman Bidara yet. Be the first to share what’s happening here.
Nearby areas in Bandar Selayang
Taman Bukit Idaman
Taman Sri Gombak
Taman Samudra
Magna Ville
Taman Selayang Mutiara
Taman Sri Batu Caves
Taman Jasa Perwira
Amara Service Residence
Bandar Baru Selayang
Symphony Heights
Taman Raintree
Batu Caves Centrepoint
Taman Bidara
PSF median price per sq ft · 12m its change over the past 12 months
Most-traded areas in this mukim, by number of recorded subsale transactions. See every area in Bandar Selayang
Market Snapshot
ResidentialRM372,500
RM481 psfMedian transaction price
Does TAMAN BIDARA rent out well?
Gross yield, median rent and sale psf — worked out from transacted prices and asking rents.
See the yield with PlusRM59 a month, cancel any time
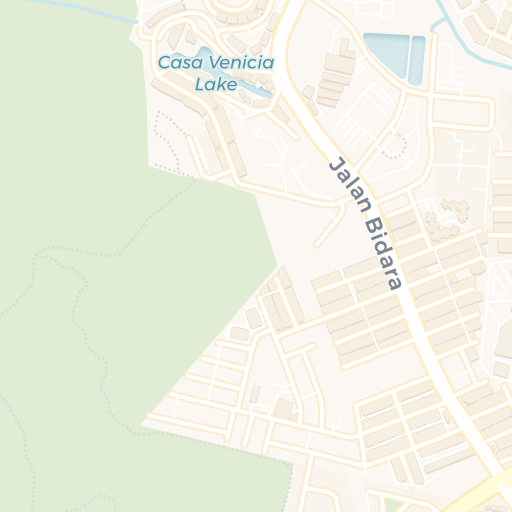
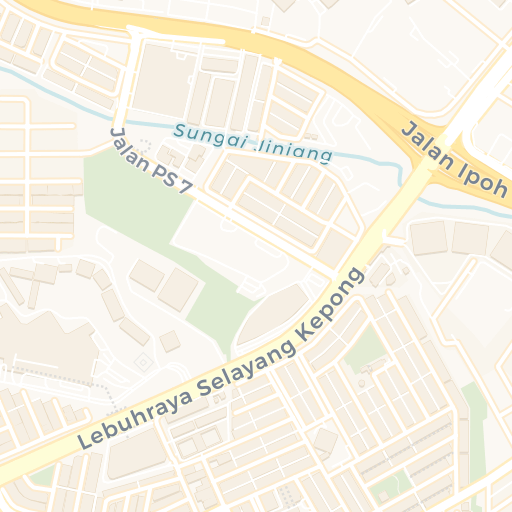
Taman Bidara, 68100 Batu Caves, Selangor, Malaysia
MapsTaman Bidara in Gombak, Selangor recorded 8 Low-Cost House properties subsale transactions between 2021 and 2026, with a median price of RM373K and a median price per square foot (PSF) of RM481.
This area contains both residential and commercial properties. View 22 residential properties or 4 commercial properties separately for more focused analysis.
Price remained flat, and PSF growth was PSF remained flat. The median price is RM373K, with most transactions falling within a stable range of RM310K to RM435K, and a typical market range of RM275K to RM480K.
Within the Low-Cost House category, 2 - 2 1/2 storey terraced dominated the market, with high diversity across multiple property types.
The median PSF stands at RM481, with core pricing between RM401 and RM561. Market pricing typically extends from RM402.53 to RM558.78, reflecting moderate variation in unit pricing. The spread of RM156.25 (IQR) and deviation of RM80 (MAD) suggest moderate price variations reflecting different property features.
While the area has shown positive growth trends, price variations suggest a more dynamic market. This presents opportunities for investors comfortable with moderate volatility. Significant price variations suggest comparing multiple properties and timing the market carefully. Limited transaction history suggests carefully evaluating comparable sales data.