| LIST.MY · Taman Nusa Seri Cengal 2 & 3 | |||||
|---|---|---|---|---|---|
|
Road
|
Price
|
PSF
|
Size
|
Date
|
Type
|
| 2025 | |||||
|
Jalan Nusa Seri Cengal
|
RM110,000
|
RM92
|
1,195 sqft
|
|
Terrace |
|
Jalan Nusa Seri Cengal 2
|
RM120,000
|
RM100
|
1,195 sqft
|
|
Terrace |
|
Jalan Nusa Seri Cengal 3
|
RM110,000
|
RM92
|
1,195 sqft
|
|
Terrace |
|
Jalan Nusa Seri Cengal 3
|
RM120,000
|
RM100
|
1,195 sqft
|
|
Terrace |
Selling in Taman Nusa Seri Cengal 2 & 3? Homes here sold for a median of RM115,000.
Free to list, about two minutes, and the buyers reading this page will see it.
Posts about Taman Nusa Seri Cengal 2 & 3
No posts about Taman Nusa Seri Cengal 2 & 3 yet. Be the first to share what’s happening here.
Nearby areas in Setul
Nilai Impian
Kawasan Perusahaan Nilai 3
Taman Semarak Ii
Taman Nusa Seri Cengal 2 & 3
Xme business park
Nilai Industrial Zone
Kawasan Perindustrian Nilai 3
Taman Desaria
Bandar Universiti Teknologi Lagenda
Taman Bukit Mantin
Taman Mantin Putra
Bandar Uni. Tekn. Lagenda (Sri Palma Villa)
PSF median price per sq ft · 12m its change over the past 12 months
Most-traded areas in this mukim, by number of recorded subsale transactions. See every area in Setul
Market Snapshot
ResidentialRM115,000
RM96 psfMedian transaction price
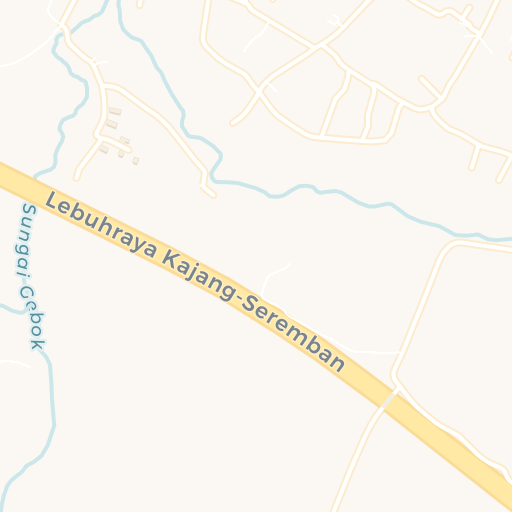
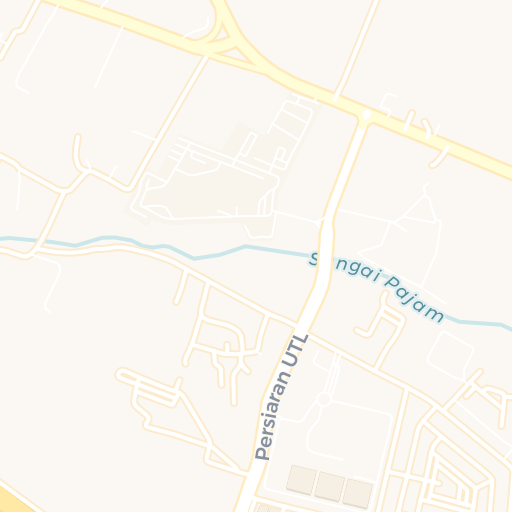
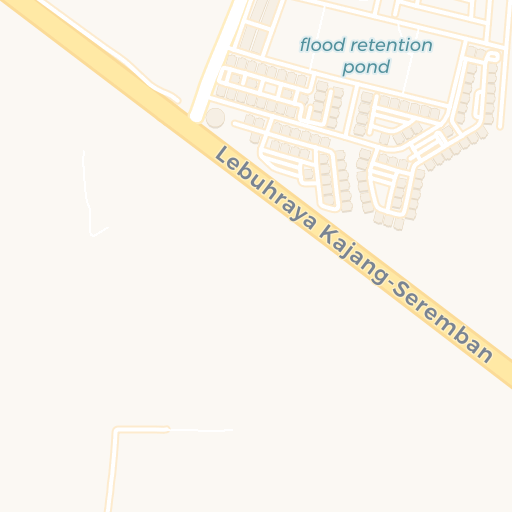

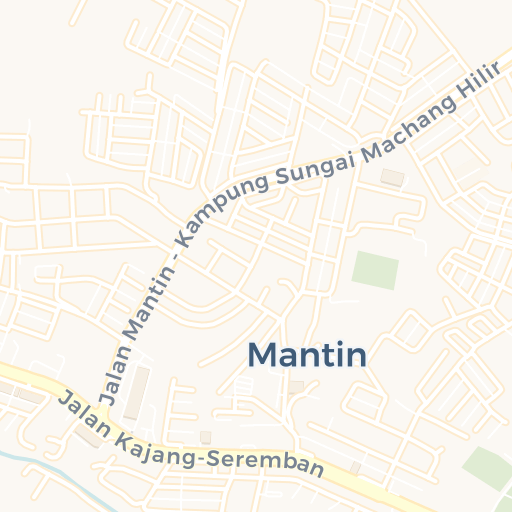
No. 95, Jalan NSC 2/6, Taman Nusa Seri Cengal 2, 71700 Mantin, Negeri Sembilan, Malaysia
MapsTaman Nusa Seri Cengal 2 & 3 in Seremban, Negeri Sembilan recorded 4 subsale transactions between 2021 and 2026, sized between 1,175 and 1,224 sqft, with a median price of RM115K and a median price per square foot (PSF) of RM96.
This area consists exclusively of residential properties, with no commercial listings recorded.
Price remained flat, and PSF growth was PSF remained flat. The median price is RM115K, with most transactions falling within a stable range of RM110K to RM120K, and a typical market range of RM110K to RM120K.
Most transactions involved 1 - 1 1/2 storey terraced, with minimal variety in property types.
For price per square foot, the median is RM96, with most transactions between RM92 and RM100. The usual range is RM49.38 to RM143.13, showing that most units are priced quite close to each other. With an IQR of RM93.75 and MAD of RM4, the PSF demonstrates reasonable consistency across the market.
While the area has shown positive growth trends, price variations suggest a more dynamic market. This presents opportunities for investors comfortable with moderate volatility. Significant price variations suggest comparing multiple properties and timing the market carefully. Limited transaction history suggests carefully evaluating comparable sales data.