Taman Industri Cheruk Tok Kun
Taman Perindustrian Bukit Minyak, Kawasan Perindustrian Bukit Minyak, 14100 Simpang Ampat, Penang, Malaysia
Taman Perindustrian Bukit Minyak, Kawasan Perindustrian Bukit Minyak, 14100 Simpang Ampat, Penang, Malaysia
| LIST.MY · Taman Industri Cheruk Tok Kun | |||||
|---|---|---|---|---|---|
|
Road
|
Price
|
PSF
|
Size
|
Date
|
Type
|
| 2022 | |||||
|
Lorong Sejahtera 22
|
RM325,000
|
RM325
|
1,001 sqft
|
|
LC House |
|
Lorong Sejahtera 28
|
RM350,000
|
RM350
|
1,001 sqft
|
|
LC House |
|
Lorong Sejahtera 29
|
RM370,000
|
RM193
|
1,916 sqft
|
|
LC House |
|
Jalan Sejahtera 1
|
RM299,000
|
RM299
|
1,001 sqft
|
|
LC House |
|
Lorong Sejahtera 26
|
RM270,000
|
RM270
|
1,001 sqft
|
|
LC House |
|
Lorong Sejahtera 28
|
RM245,000
|
RM245
|
1,001 sqft
|
|
LC House |
Selling in Taman Industri Cheruk Tok Kun? Homes here sold for a median of RM312,000.
Free to list, about two minutes, and the buyers reading this page will see it.
Posts about Taman Industri Cheruk Tok Kun
No posts about Taman Industri Cheruk Tok Kun yet. Be the first to share what’s happening here.
Nearby areas in 15
Taman Sri Janggus
Taman Jasa Intan Fasa Ii
Pangsapuri Pinggiran Machang Bubok 1
Taman Sejahtera (Spt)
Taman Pinggiran Machang Bubok
Taman Desa Impian 2 (Fasa 2)
Taman Seri Impian
Taman Seri Kijang
Taman Permata
Hill Park Residensi
Taman Machang Bubok
Taman Desa Impian
Taman Industri Cheruk Tok Kun
PSF median price per sq ft · 12m its change over the past 12 months
Most-traded areas in this mukim, by number of recorded subsale transactions. See every area in 15
Market Snapshot
ResidentialRM312,000
RM284 psfMedian transaction price
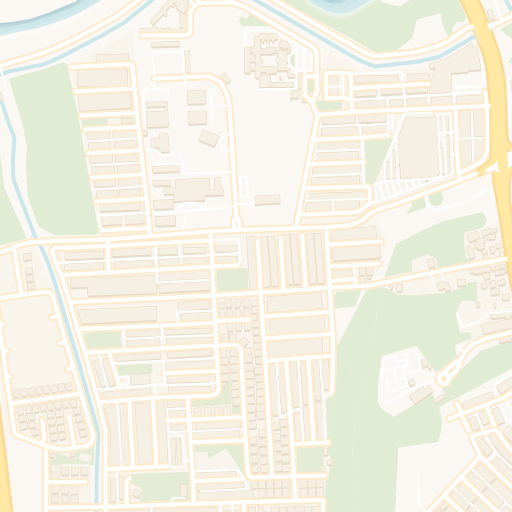
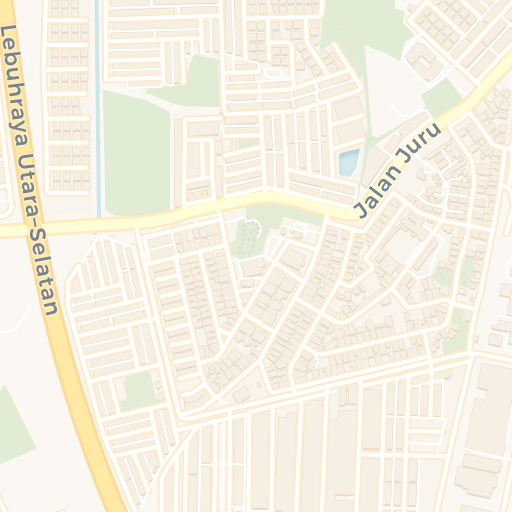
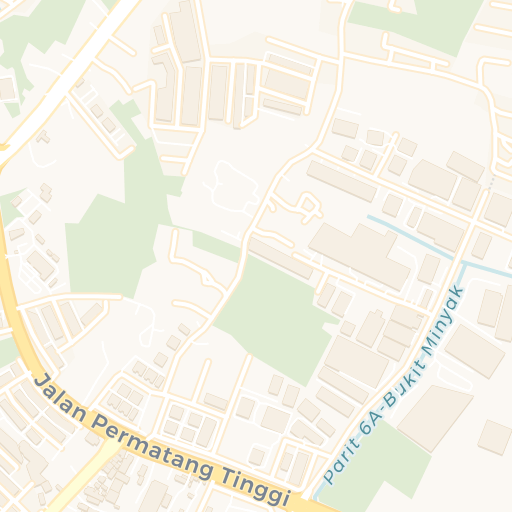
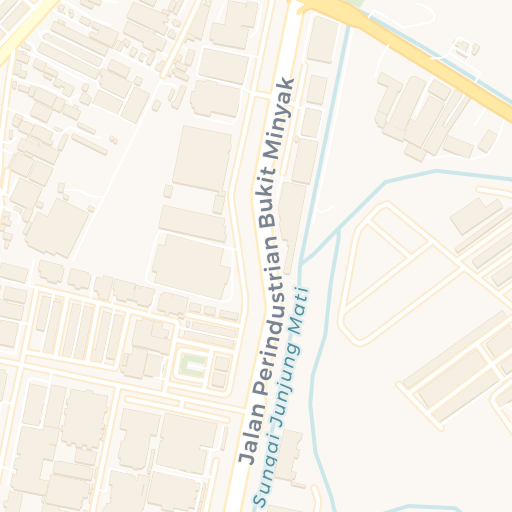
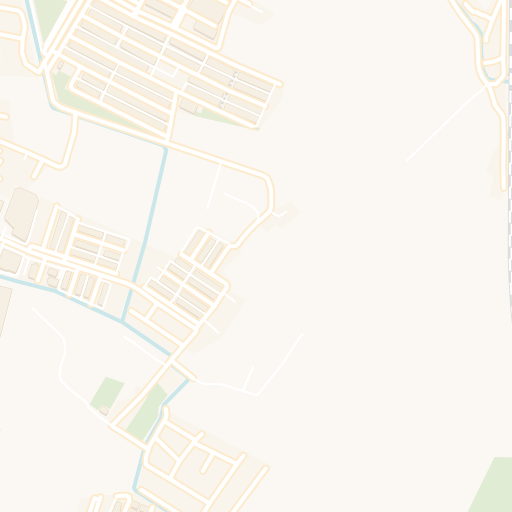
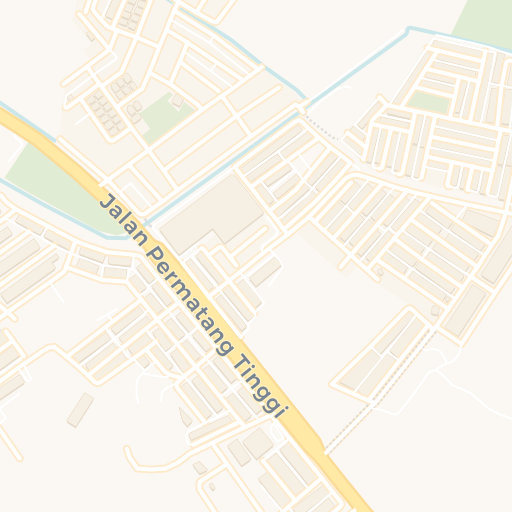
Taman Perindustrian Bukit Minyak, Kawasan Perindustrian Bukit Minyak, 14100 Simpang Ampat, Penang, Malaysia
MapsTaman Industri Cheruk Tok Kun in Seberang Perai Tengah, Penang recorded 6 subsale transactions in 2022, with a median price of RM312K and a median price per square foot (PSF) of RM284.
This area contains both residential and commercial properties. View 13 residential properties or 3 commercial properties separately for more focused analysis.
Price remained flat, and PSF growth was PSF remained flat. The median price is RM312K, with most transactions falling within a stable range of RM268K to RM356K, and a typical market range of RM263K to RM361K.
Most transactions involved low-cost house, though some variety exists in the market.
The median PSF stands at RM284, with core pricing between RM232 and RM336. Market pricing typically extends from RM244.45 to RM323.95, reflecting moderate variation in unit pricing. The spread of RM79.50 (IQR) and deviation of RM52 (MAD) suggest moderate price variations reflecting different property features.
While the area has shown positive growth trends, price variations suggest a more dynamic market. This presents opportunities for investors comfortable with moderate volatility. Significant price variations suggest comparing multiple properties and timing the market carefully. Limited transaction history suggests carefully evaluating comparable sales data.