Selling in Senai Industrial Park? Homes here sold for a median of RM4,900,000.
Free to list, about two minutes, and the buyers reading this page will see it.
Posts about Senai Industrial Park
No posts about Senai Industrial Park yet. Be the first to share what’s happening here.
Nearby areas in Senai
Bandar Putra
Taman Scientex Senai
D'art Hills Residence
Taman Mutiara Hijau
D'putra Suites
Taman Senai Jaya
Taman Saga
Taman Desa Idaman
Taman Impian Senai
Senai Industrial Park
Taman Mewah Kulai
Taman Makmur
PSF median price per sq ft · 12m its change over the past 12 months
Most-traded areas in this mukim, by number of recorded subsale transactions. See every area in Senai
Market Snapshot
CommercialRM4,900,000
RM101 psfMedian transaction price
Know your return before you buy
See the gross rental yield for SENAI INDUSTRIAL PARK and compare before you put down a deposit.
Get PlusRM59 a month, cancel any time
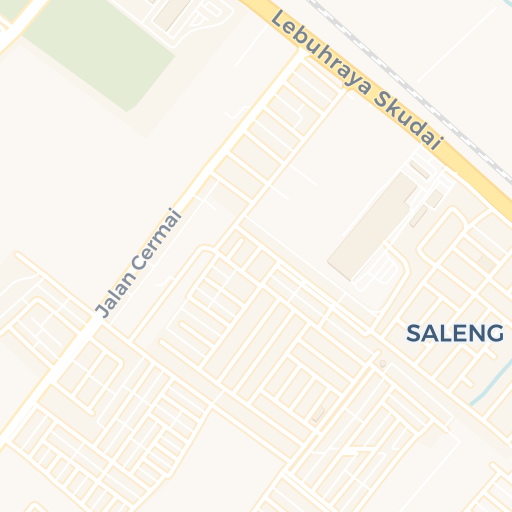



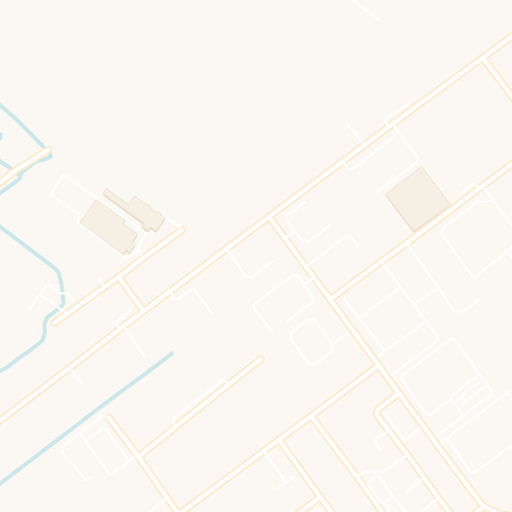

Park, Taman Selang Jaya, 81400 Senai, Johor, Malaysia
MapsSenai Industrial Park in Kulai, Johor recorded 1 subsale transactions between 2021 and 2026, sized between 48,425 and 48,474 sqft, with a median price of RM4.90 million and a median price per square foot (PSF) of RM101.
This area consists exclusively of commercial properties, with no residential listings recorded.
Price remained flat, and PSF growth was PSF remained flat.
Most transactions involved semi-detached factory/warehouse, with high diversity across multiple property types.
For price per square foot, the median is RM101, with most transactions between RM101 and RM101. The usual range is RM50.18 to RM152.18, showing that most units are priced quite close to each other. With an IQR of RM102.00 and MAD of RM0, the PSF demonstrates reasonable consistency across the market.
Overall, the market in this area appears stable with consistent appreciation, making it an attractive option for both investors and homebuyers. Despite diverse property types, prices remain relatively stable, offering options for different buyer preferences. Limited transaction history suggests carefully evaluating comparable sales data.