| LIST.MY · Subang Bestari | |||||
|---|---|---|---|---|---|
|
Road
|
Price
|
PSF
|
Size
|
Date
|
Type
|
| 2024 | |||||
|
Jalan Nova U5/66
|
RM750,000
|
RM377
|
1,991 sqft
|
|
2-Sty Terrace |
|
Jalan Nova U5/65
|
RM730,000
|
RM367
|
1,991 sqft
|
|
2-Sty Terrace |
| 2023 | |||||
|
Jalan Nova U5/65
|
RM640,000
|
RM321
|
1,991 sqft
|
|
2-Sty Terrace |
| 2022 | |||||
|
Jalan Nova U5/92C
|
RM950,000
|
RM480
|
1,981 sqft
|
|
2-Sty Terrace |
|
Jalan Nova U5/65
|
RM700,000
|
RM352
|
1,991 sqft
|
|
2-Sty Terrace |
|
Jalan Nova U5/65
|
RM615,000
|
RM309
|
1,991 sqft
|
|
2-Sty Terrace |
Selling in Subang Bestari? Homes here sold for a median of RM715,000.
Free to list, about two minutes, and the buyers reading this page will see it.
New Launches in Selangor
View all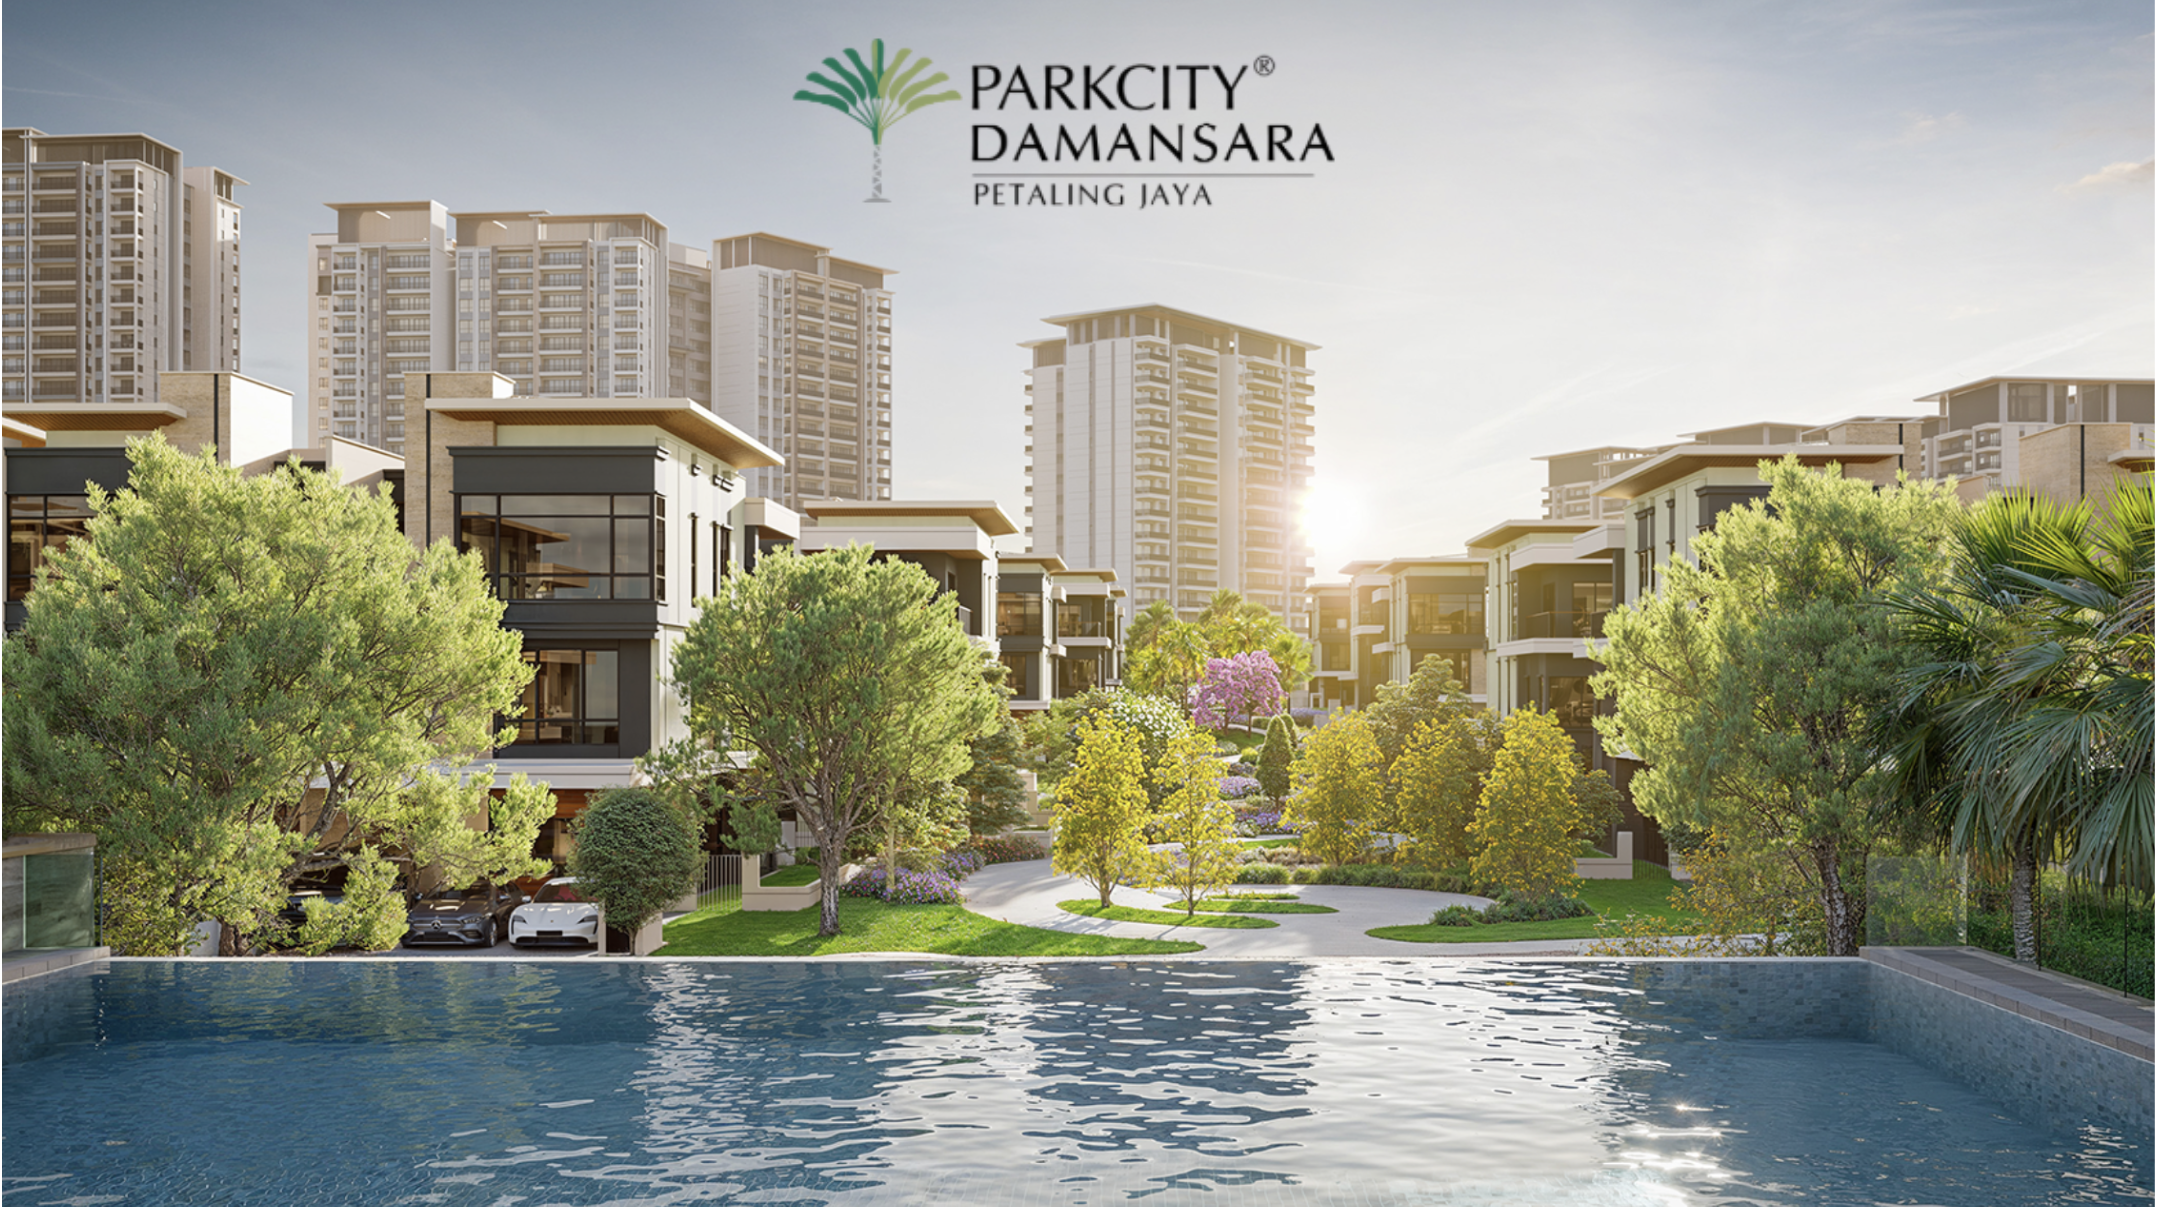
Posts about Subang Bestari
No posts about Subang Bestari yet. Be the first to share what’s happening here.
Nearby areas in Sungai Buluh
Elmina West
Flora Damansara-Jalan PJU 8/9(P/Puri)
Elmina East
Bandar Baru Sri Damansara
Subang Bestari
Bandar Damansara Perdana
P/Puri Suria Subang-U5 Bandar Pinggran Sbg
R/P Kos Rendah - Idaman (D'sara Damai)
Pangsapuri Saujana-Damansara Damai
Amverton Hills
Mutiara Damansara
Damansara Damai - Harmoni
PSF median price per sq ft · 12m its change over the past 12 months
Most-traded areas in this mukim, by number of recorded subsale transactions. See every area in Sungai Buluh
Property News
More property news →
Market Snapshot
ResidentialRM715,000
RM359 psfMedian transaction price
Know your return before you buy
See the gross rental yield for SUBANG BESTARI and compare before you put down a deposit.
Get PlusRM59 a month, cancel any time
Subang Bestari, 40150 Shah Alam, Selangor, Malaysia
MapsSubang Bestari in Petaling, Selangor recorded 6 subsale transactions between 2021 and 2026, sized between 1,975 and 2,024 sqft, with a median price of RM715K and a median price per square foot (PSF) of RM359.
This area consists exclusively of residential properties, with no commercial listings recorded.
Price remained flat, and PSF growth was PSF remained flat. The median price is RM715K, with most transactions falling within a stable range of RM615K to RM824K, and a typical market range of RM615K to RM950K.
Most transactions involved 2 - 2 1/2 storey terraced, with moderate diversity in property types available.
The median PSF stands at RM359, with core pricing between RM304 and RM415. Market pricing typically extends from RM303.56 to RM414.56, reflecting moderate variation in unit pricing. The spread of RM111.00 (IQR) and deviation of RM56 (MAD) suggest moderate price variations reflecting different property features.
While the area has shown positive growth trends, price variations suggest a more dynamic market. This presents opportunities for investors comfortable with moderate volatility. Significant price variations suggest comparing multiple properties and timing the market carefully. Limited transaction history suggests carefully evaluating comparable sales data.