| LIST.MY · Taman Eng Ann | |||||
|---|---|---|---|---|---|
|
Road
|
Price
|
PSF
|
Size
|
Date
|
Type
|
| 2022 | |||||
|
Jalan Kasawari 4
|
RM420,000
|
RM219
|
1,914 sqft
|
|
Terrace |
|
Jalan Serindit 11
|
RM665,000
|
RM351
|
1,894 sqft
|
|
2-Sty Terrace |
New Launches in Selangor
View all
Posts about Taman Eng Ann
No posts about Taman Eng Ann yet. Be the first to share what’s happening here.
Nearby areas in Kapar
Bandar Bukit Raja
Taman Klang Utama
Bandar Sultan Suleiman
Taman Sungai Kapar Indah
Taman Desa Bukit Nilam
Taman Aman Perdana
Serunai Apartment, Bandar Bukit Raja
Taman Desa Intan
Taman Perepat Indah
Klang Sentral
Ken Rimba Sek. 16
Pangsapuri Rimba 2
Taman Eng Ann
PSF median price per sq ft · 12m its change over the past 12 months
Most-traded areas in this mukim, by number of recorded subsale transactions. See every area in Kapar
Market Snapshot
ResidentialRM542,500
RM285 psfMedian transaction price
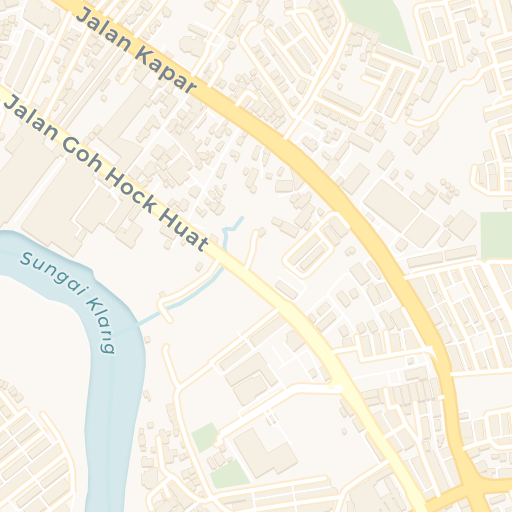
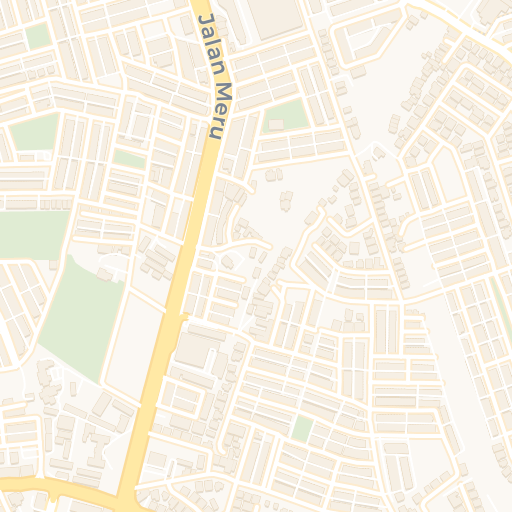
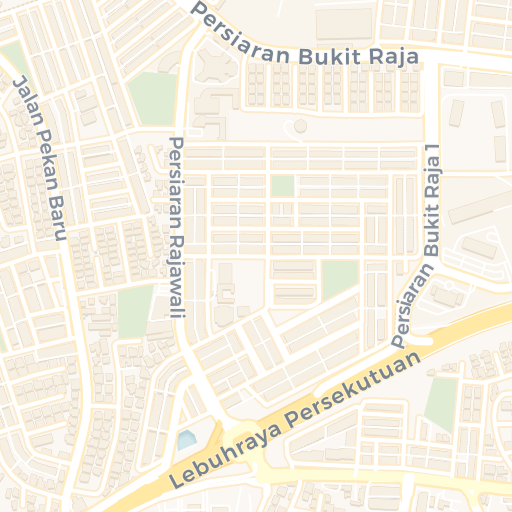
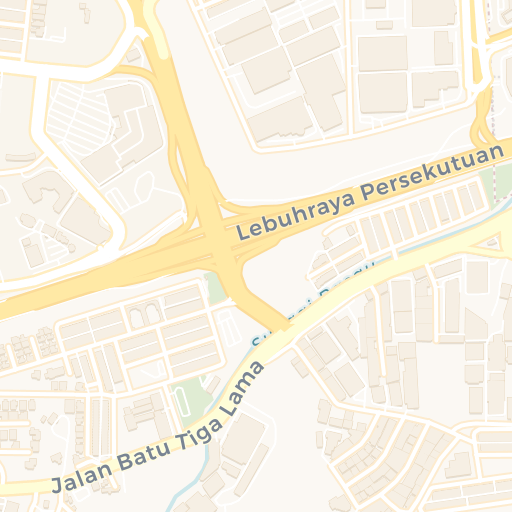
Taman Eng Ann, Klang, Selangor, Malaysia
MapsTaman Eng Ann in Klang, Selangor recorded 2 subsale transactions between 2021 and 2026, sized between 1,875 and 1,924 sqft, with a median price of RM543K and a median price per square foot (PSF) of RM285.
This area contains both residential and commercial properties. View 48 residential properties or 2 commercial properties separately for more focused analysis.
Price remained flat, and PSF growth was PSF remained flat. The median price is RM543K, with most transactions falling within a stable range of RM420K to RM665K, and a typical market range of RM420K to RM665K.
Most transactions involved 1 - 1 1/2 storey terraced, with high diversity across multiple property types.
Price per square foot shows a median of RM285, though individual units vary from RM219 to RM351 in the core range. The broader market spans RM231.23 to RM339.23, indicating diverse property characteristics. The spread of RM108.00 (IQR) and deviation of RM66 (MAD) suggest moderate price variations reflecting different property features.
While the area has shown positive growth trends, price variations suggest a more dynamic market. This presents opportunities for investors comfortable with moderate volatility. Significant price variations suggest comparing multiple properties and timing the market carefully. Limited transaction history suggests carefully evaluating comparable sales data.