Mahkota Square
No. 9 & 11, Mahkota Square, Jalan Temenggung 23/9, Bandar Mahkota Cheras, 43200 Cheras, Selangor, Malaysia
No. 9 & 11, Mahkota Square, Jalan Temenggung 23/9, Bandar Mahkota Cheras, 43200 Cheras, Selangor, Malaysia
| Road | Price | PSF | Size | Date | Type |
|---|
|
Jalan Temenggung 29/9
|
RM3,100,000
|
RM696
|
4,456 sqft
|
|
|
Jalan Temenggung 25/9
|
RM2,700,000
|
RM553
|
4,887 sqft
|
|
Selling in Mahkota Square? Homes here sold for a median of RM2,700,000.
Free to list, about two minutes, and the buyers reading this page will see it.
New Launches in Selangor
View all
Posts about Mahkota Square
No posts about Mahkota Square yet. Be the first to share what’s happening here.
Nearby areas in Cheras
Bandar Mahkota Cheras
Bandar Damai Perdana
Bandar Sungai Long
Taman Segar Perdana
Twin Palm
Taman Cheras Jaya
Bandar Tun Hussein Onn
Taman Megah (Cheras)
Garden Park
Taman Bkt Sungai Long
Cloudtree Residence
Palm Walk , Bandar Sungai Long
Mahkota Square
PSF median price per sq ft · 12m its change over the past 12 months
Most-traded areas in this mukim, by number of recorded subsale transactions. See every area in Cheras
Market Snapshot
CommercialRM2,700,000
RM553 psfMedian transaction price
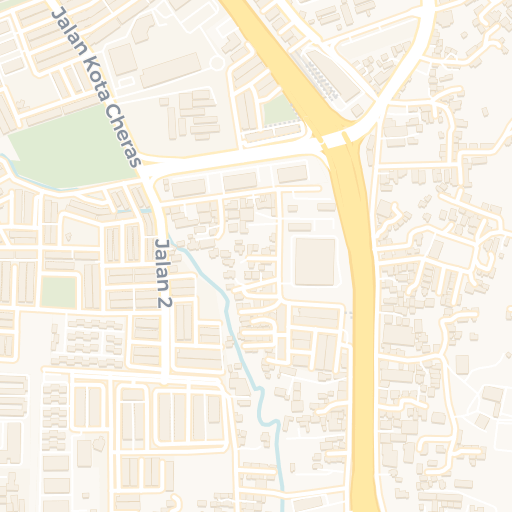
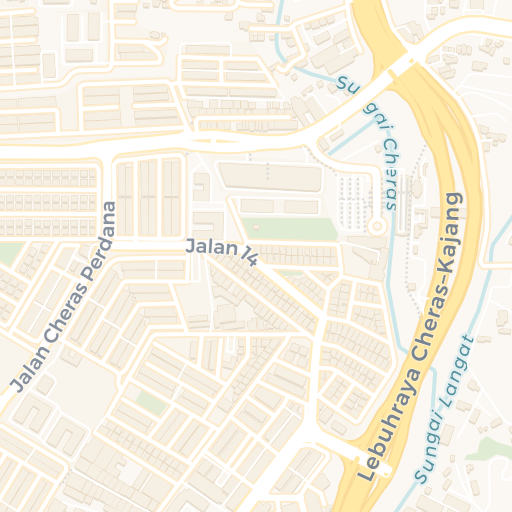
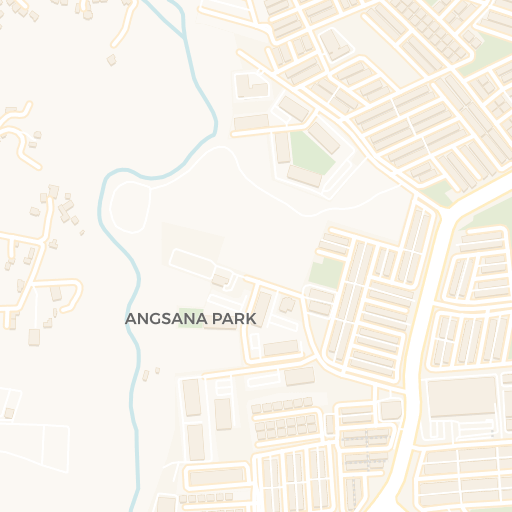
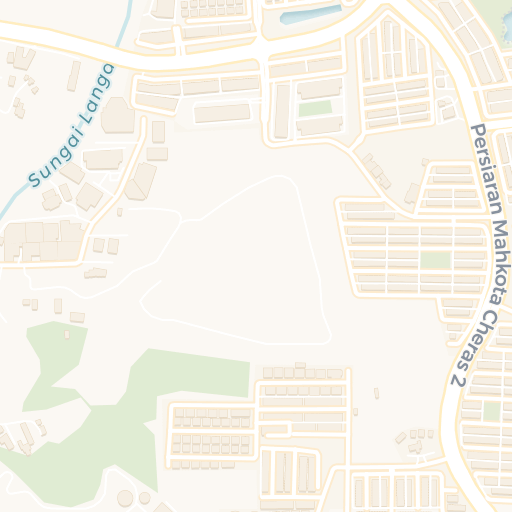
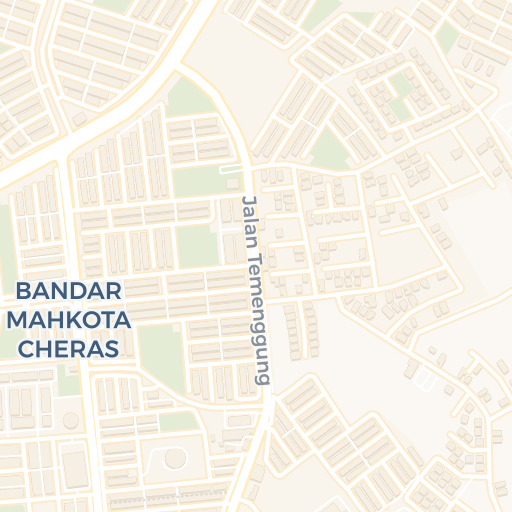
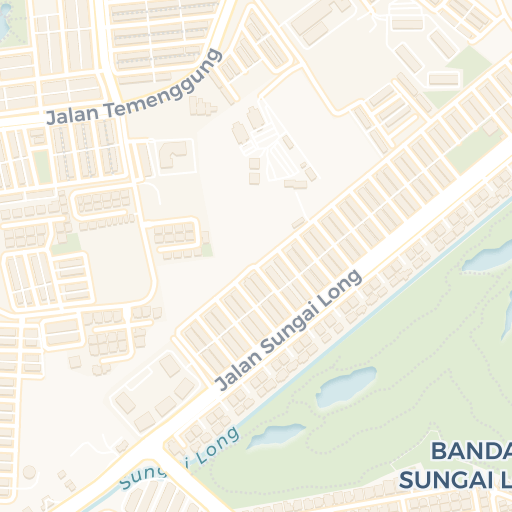
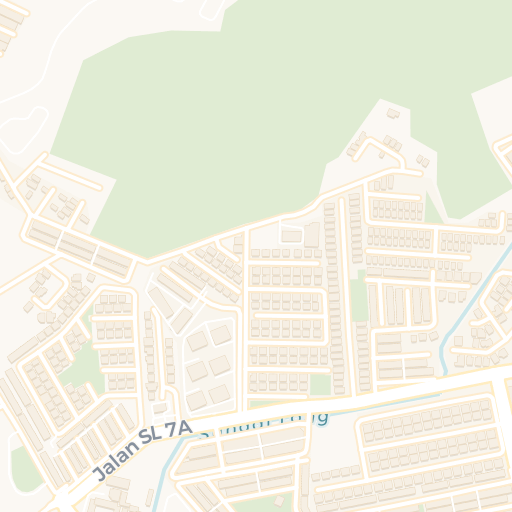
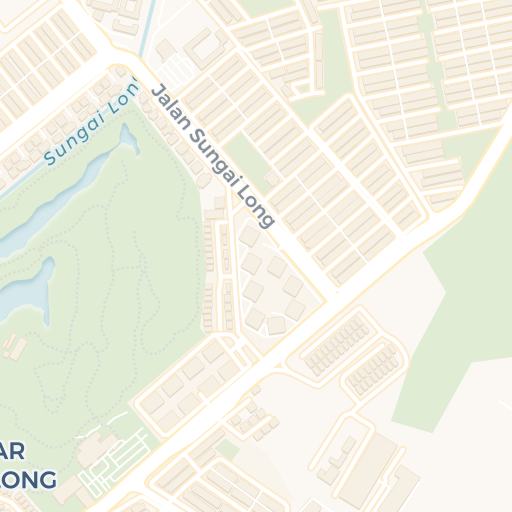
No. 9 & 11, Mahkota Square, Jalan Temenggung 23/9, Bandar Mahkota Cheras, 43200 Cheras, Selangor, Malaysia
MapsMahkota Square in Hulu Langat, Selangor recorded 3 subsale transactions in 2025, with a median price of RM2.70 million and a median price per square foot (PSF) of RM553.
This area consists exclusively of commercial properties, with no residential listings recorded.
Price remained flat, and PSF growth was PSF remained flat. The median price is RM2.70 million, with most transactions falling within a stable range of RM1.48 million to RM3.10 million, and a typical market range of RM1.46 million to RM3.10 million.
Most transactions involved 3 - 3 1/2 storey shop, though some variety exists in the market.
The median PSF stands at RM553, with core pricing between RM483 and RM622. Market pricing typically extends from RM0.00 to RM1,200.64, reflecting moderate variation in unit pricing. With an IQR of RM1,296.25 and MAD of RM70, the PSF demonstrates reasonable consistency across the market.
While the area has shown positive growth trends, price variations suggest a more dynamic market. This presents opportunities for investors comfortable with moderate volatility. Significant price variations suggest comparing multiple properties and timing the market carefully. Limited transaction history suggests carefully evaluating comparable sales data.